By Audrey Hsi
Edited by Mika Mei Jia Tan, Pablo Arturo López-Guijosa, Jennifer Rae Pierce
August 7, 2020
Introduction to UBHub and its functions
Since its launch in 2018, the team at the Urban Biodiversity Hub (UBHub) has been committed to providing free, up-to-date information on urban biodiversity endeavours by cities of various sizes around the world. The ever-growing UBHub database includes biodiversity programs, initiatives and plans and were initially built off research by Pierce (2014). Thanks to a large network of practitioners and internet research, UBHub was able to broaden the database even further and now contains urban biodiversity information from all 7 continents - even the Palmer research station in Antarctica participated in the Cities of Nature Challenge![1] Since the launch of their database in 2018, UBHub has offered open access to its resources to help increase accessibility for individuals and cities to urban biodiversity practices. The compilation of data and programs can be explored on a filterable georeferenced database found on their website, ubhub.org.
A 2020 update has registered over a hundred newly added biodiversity reports, plans and programs to the UBHub database. Data taken from UBHub’s 2018 The Nature of Cities report (TNOC) compared to the new comprehensive data has revealed shifting trends and patterns over the past two years and displays the world's recent and past responses to urban biodiversity measures.
Biodiversity Plan and Reports: From 2018 to 2020
Since 2018, UBHub data has shown an increase in biodiversity documents
Biodiversity plans and reports are crucial to the coordination and implementation of local urban biodiversity programs and activities. UBHub defines a municipal biodiversity plan as an official local government document that outlines goals for biodiversity and strategies or actions to attain these goals. Municipal biodiversity reports are defined by UBHub as an ecosystem health and/or biodiversity assessment published by the local government and that may be condensed for the public. UBHub continuously updates the database, and in the last year, has made particular efforts to update the number of municipal biodiversity plans in particular. As of 2020, UBHub’s database lists 189 municipalities in 6 continents that have released biodiversity plans and/or biodiversity reports.
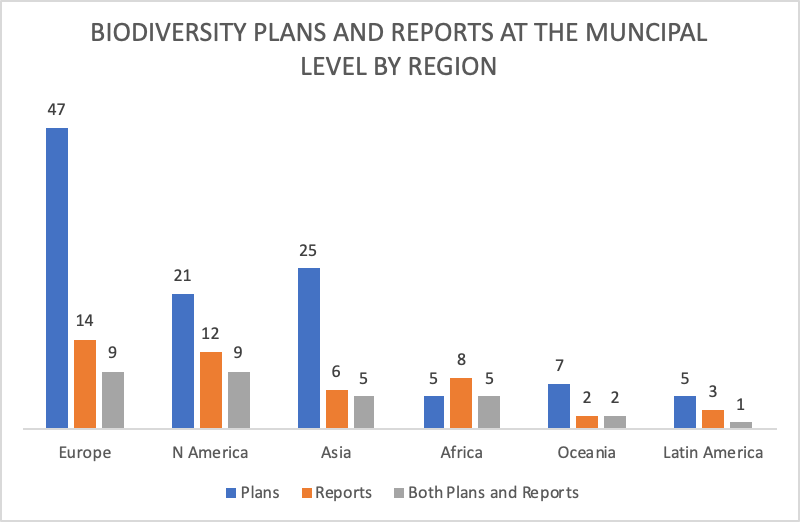
Updated graph of the number of municipalities that have published biodiversity reports/plans (by region). A total of 117 cities have published biodiversity plans; 45 have published biodiversity reports. Of these, 31 have published both. European cities are the biggest contributor to these numbers. Data is based on the ubhub.org/map.
UBHub’s 2018 update published in the Nature in the Urban Century Assessment (McDonald et al. 2018), reported at least 123 municipalities in 31 countries published biodiversity plans and/or reports. In this 2020 update, there has been a 2% increase in municipalities that have published biodiversity plans and/or reports, resulting in a total of 125 municipalities. The following cities issued biodiversity plans in the update: Oslo(Norway), London (England), Pimpri Chinchwad (India), and Tel Aviv (Israel). As for biodiversity reports, the city of Kawasaki (Japan) was the only city to have published a biodiversity report since 2018 based on UBHub’s current data though it should be noted that while UBHub made specific efforts to update biodiversity plans, reports did not receive the same attention. As a result, newly published biodiversity reports may have been missed in the count.
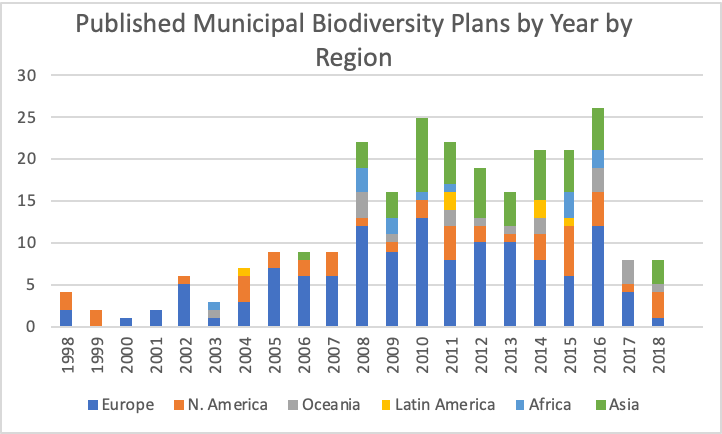
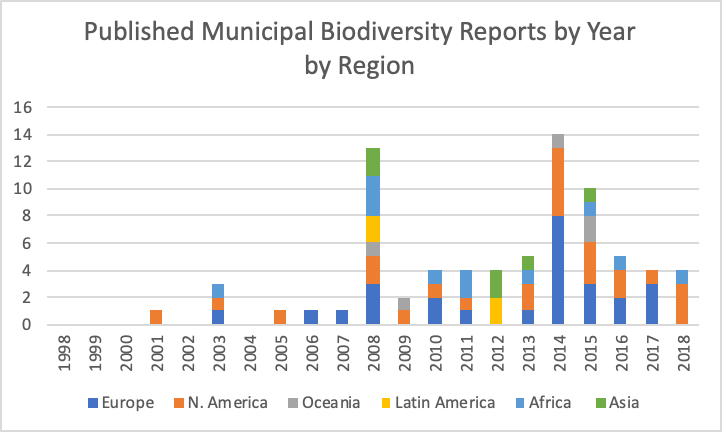
Graphs of the number of biodiversity plans, reports and plans/reports published by municipalities around the world per year by region over the past 20 years. The total number of plans/ reports in the UBHub database are 263 and 76 respectively. The total number of published biodiversity documents in the last 20 years is 256 for plans and 77 for reports. UBHub data on biodiversity documents goes back to 1992, which are not accounted for in the graph. The year of publication is missing on some biodiversity documents in the database as well, which also contributes to the lower number in total biodiversity plans and reports published on the graph. The peak of published documents occurred in 2008 and 2014 or 2016. After 2014, there has been a decline in published biodiversity reports. Note that North America is defined according to the World Bank regions, and as such, includes only Canada, the USA and Bermuda, whereas Latin America encompasses the rest of the Americas and the Caribbean.
The annual number of municipal biodiversity document publications has declined since 2016
In terms of the trends for published biodiversity documents over a 20 year period from 1998 to 2018, the pattern is relatively similar. For the municipal biodiversity documents, there are definite peak years for publication. The first peak occurred in 2008 when there were 22 published plans and 13 published reports. This spike may be partly attributed to ICLEI’s 2006 Local Action for Biodiversity (LAB) Pioneer pilot program which had 19 municipal participants and included the publication of each type of document in its stepwise framework. In 2009, 300 local governments attended the ICLEI General Assembly where the LAB pilot program was announced (CBD 2012) and this may have raised the profile of these types of documents for years to come. Several other programs debuted during this time, including the Singapore Index in 2010, and there was a particular focus on biodiversity internationally with the UN announcement of the year of Biodiversity in 2010 and the Decade for Biodiversity in 2011. The next peaks were staggered, with 14 biodiversity reports published in 2014 and 26 biodiversity plans in 2016.
While the publication of biodiversity reports started to decline after peaking in 2014,the publication of biodiversity plans did not decline until the last two years. There are a myriad of potential reasons for these recent declines. One may be the Eurozone recession of 2014, which resulted in budget cuts (Weisbrot 2014). Since cities in the Eurozone contribute to 40% of identified local biodiversity plans and reports, it is possible that this recession contributed to the reduced number of these publications. Another may be that ICLEI has shifted its focus from the LAB program to other types of programs that are less focused on the publication of biodiversity reports and plans in favor of other approaches.
Future outlook for biodiversity documents
This combination of factors could have resulted in the dwindling in biodiversity documents over the past years. Unfortunately, the recent COVID-19 pandemic has disrupted all federal and local governmental plans around the world and will most likely have a negative impact on the publication of biodiversity documents for the immediate years to come.
Preventing unnecessary human and wildlife that could potentially carry zoonotic diseases/viruses is an important lesson learned from the COVID-19 pandemic. Biodiversity plans and reports can help minimize the interaction between large amounts of wildlife and large populations. Biodiversity plans can help to streamline the process of conserving the already existing biodiversity in the area and biodiversity reports can help cities maintain a healthy and diverse ecosystem.
Biodiversity frameworks and programs: From 2018 to 2020
Biodiversity frameworks and programs function as a tool for measurements and resources for urban biodiversity in municipalities
The UBHub database also compiles municipal participants of biodiversity programs and frameworks. There are 31 different types of programs and frameworks that are featured on the UBHub database. Biodiversity programs assist their municipal members by offering support and systemized plans for the municipality to follow. Sometimes, programs will charge a fee in exchange for these membership benefits. Another part of being a municipal member of a biodiversity program include publishing biodiversity documents, starting pilot programs, making political commitments or joining specific networks that include other members. ICLEI programs and alliances that are featured in the database include the Local Action for Biodiversity (LAB); LAB Communication, Education and Public Awareness Program (CEPA); LAB Wetland Program; and the INTERACT-Bio program. Other non-ICLEI biodiversity programs include the Cities with Nature program that started in 2018 and recorded 125 new participants in this recent UBHub update. The primary function of biodiversity frameworks is to provide a standardized method for biodiversity measurements and indices. Frameworks such as the Singapore index and the Ecological Footprint consolidate several numeric indicators into a single number, creating a biodiversity ‘score’ or index, indicative of the municipality’s overall biodiversity condition and planning efforts. New frameworks that were recently created in 2018 include the Urban Sustainability Framework (USF), which was created by the Global Environment Facility (GEF) and the Circle of Sustainability. These indices measure biodiversity, which then acts as a part of a larger, overarching sustainability tool for municipalities to use.

Updated graph of municipal participants (by continent) of a few international biodiversity programs and frameworks. Mayors Monarch pledge has the highest number of municipal participants all from North America. Data was gathered from ubhub.org/map.
In 2018, the program with the highest number of municipal-participants found in the UBHub program and framework database was the Mayors Monarch pledge with over 300 municipalities, all from North America. The newly updated data shows that the Mayors Monarch Pledge has increased its municipal participants by 74 municipalities, and has also retained its spot as the biodiversity program with the highest number of municipal participants in the UBHub database. The Mayors Monarch Pledge was created by the National Wildlife Federation (USA), due to the range of Monarch butterflies, all of the participants are from North America. The program itself awards points for a predetermined list of 24 actions that municipalities take to benefit Monarch butterflies. After an annual report on Monarch butterfly actions from each city, they are awarded either “Monarch Champion” or “leadership circle” based on the number of particular actions taken.
Six biodiversity frameworks and programs have increased the number of participants while the ICLEI CEPA program recorded no new numbers. One of the biggest increases seen since 2018 was in the Ecological Footprint framework and the Cities with Nature program. The Ecological Footprint increased by 50% in the number of different municipal participants and has grown to become one of the biggest frameworks in the UBHub database. As a framework, the Ecological Footprint measures the amount of nature that is needed to sustain humanity or the economy. The large numbers of Asian municipal participants could be accounted for by the 12 different Asian Ecological Footprint reports that published over 100 Asian municipal ecological footprints (Footprint Network 2020). UBHub’s updated data on the Cities with Nature Program reported over 5 times the number of participants since the launch of the UBHub database in 2018. The Cities with Nature works to focus the limelight on the importance of nature within cities. The program also created an international platform for cities and their partners to communicate and engage with each other in order to move towards a more sustainable environment in an urban setting.


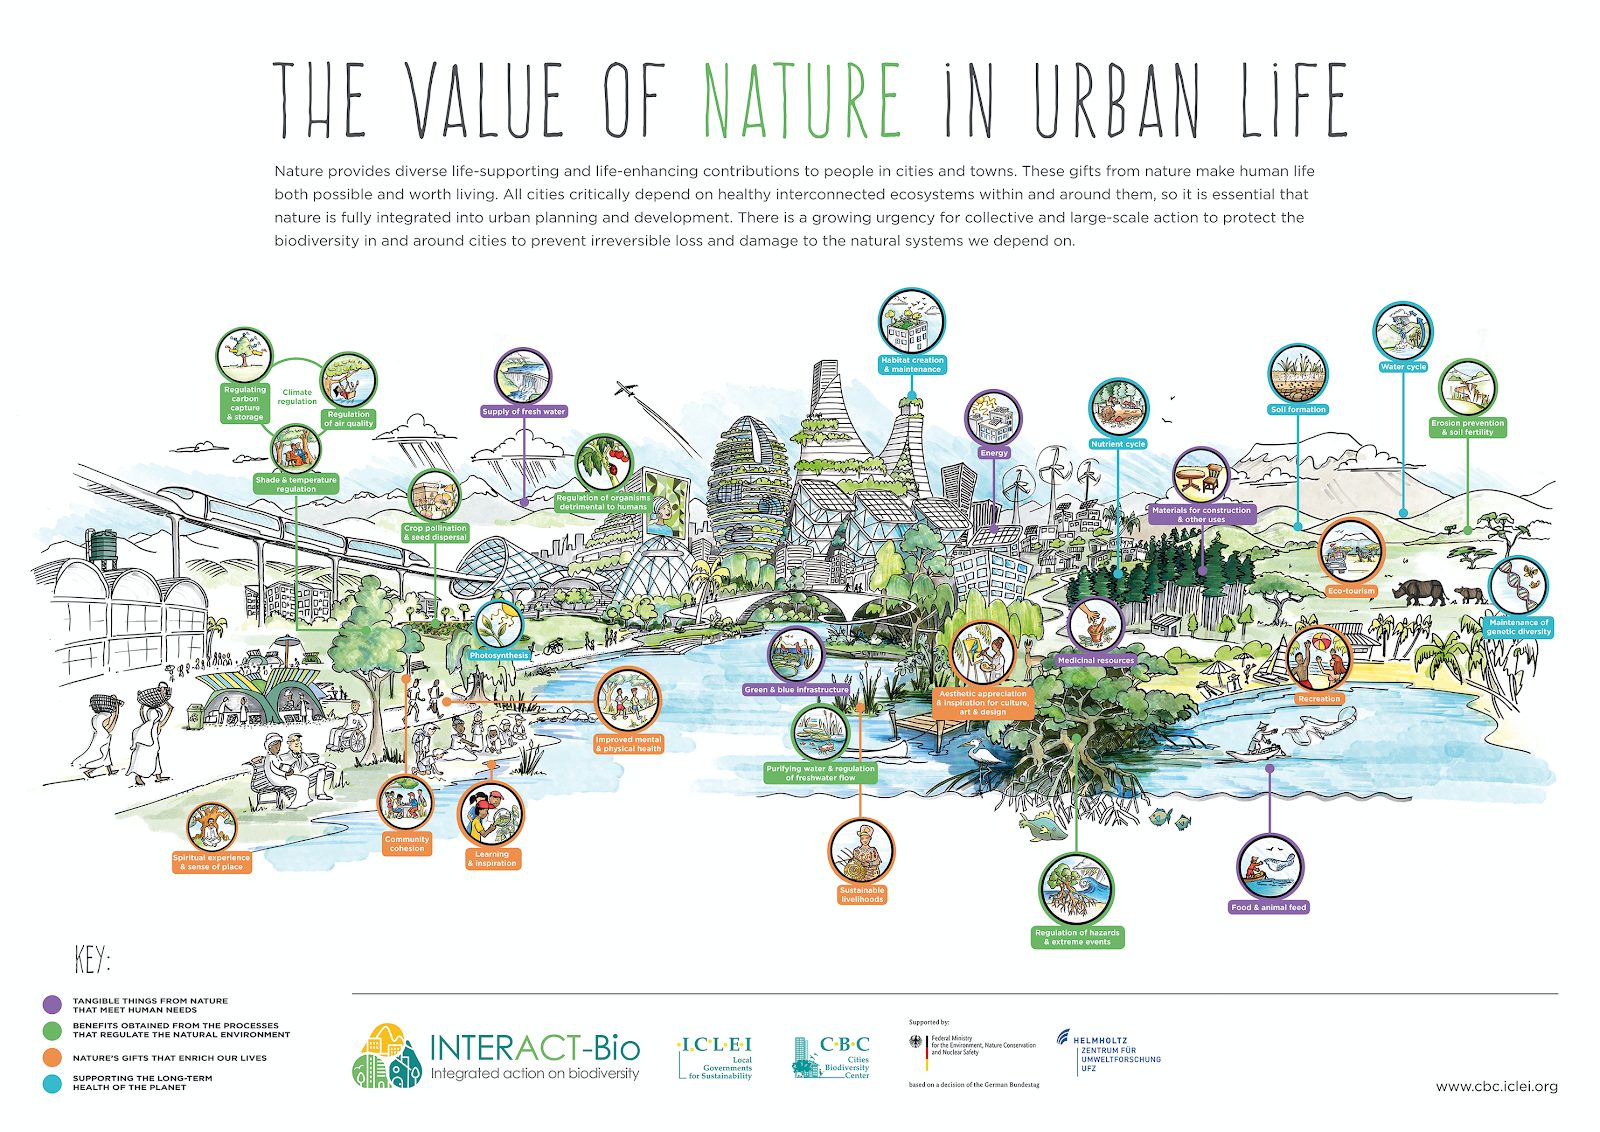
From left to right: Map of urban biodiversity benefits taken from https://cwn.iclei.org. Global Footprint Network promotes the calculation of Ecological footprints with more information on their website https://www.footprintnetwork.org. Mayor Francis Slay of St. Louis Missouri and the President and CEO of the National Wildlife Federation (NWF) launch the Mayors Monarch Program in 2015.
Increased biodiversity programs and framework numbers could be attributed to more centralized information and data collection
The rapid increase in the number of ecological footprints can be partially attributed to the founding of the Global Footprint Network in 2003. The Global Footprint Network uses data from the UN from 1961 to present day to calculate the ecological footprint for countries all over the world (Footprint network 2020). Reports and studies, such as the previously mentioned Living Planet report, have also contributed to the large increase in city participants in the ecological footprint framework. In total, there are 589 ecological footprints but many municipalities are recurring participants to the framework. For example, Barbados and Singapore alone accounted for a total of 53 Ecological Footprints, with at least two Ecological Footprints for a large handful of other municipalities. The reason for the exponential increase in the number of Cities with Nature participants could be from the fact that the ICLEI founded program just started in 2018 and lacked significant participation as it was just starting out.

Graph of municipal participants in biodiversity program by population size. Majority of the municipal participants of the Mayors Monarch pledge have populations less than 100,000. Other programs, such as the Ecological Footprint, have participants of all different population sizes.
Distribution of municipal participants in biodiversity programs and frameworks vary by size
Certain biodiversity programs and frameworks target specific municipalities who share similar interests to the program mission. Generally, biodiversity programs and frameworks are relatively spread out in terms of municipal participant population size, with most of the participant population concentrated between 1,000,000 to 500,000. Many programs don’t have municipal participants over 5,000,000 except for Ecological Footprints. Similarly, the Mayors Monarch pledge has a significant number of participants on the other side of the scale with the majority of their participant populations less than 100,000.
What is significant about the Mayors Monarch program is that all of their participants are from North America as it is the only home for Monarch butterflies. Based on our findings, it seems that the Mayors Monarch pledge not only consists of North American municipalities but are targeting municipal populations of 200,000 or smaller. A reason for the targeted participants could just be that there are larger monarch populations located by smaller municipalities. On the opposite end of the spectrum, the Ecological Footprint framework has the most participants with populations over 5,000,000. A possible reason for the large participant population in the framework could be related to the previously aforementioned growth in Asian participants in the ecological footprint. Asian cities are some of the largest and fastest growing cities in the world in terms of population and infrastructure. Chinese municipalities alone account for 50% of the total ecological footprints participants with populations over 5,000,000.
Conclusion
Our team at UBHub has been committed to ensuring that municipal biodiversity programs, documents and framework are recorded and organized for the international community of environmentalists. Since 2018, UBHub has grown its database with data from all continents and over a thousand cities. Despite the apparent growth in the database, much of the increase in data could be due to a rise in easy-to-access urban biodiversity information rather than a spread in recent urban biodiversity advancements. The past two years have marked an end of an era but also new beginnings for some biodiversity frameworks and programs. 2020 is considered to be the deadline and year of assessment for large frameworks of biodiversity policies and goals under the Convention on Biological Diversity, which includes the Aichi targets (IDDRI 2018). But the cycle continues anew as post-2020 biodiversity framework discussions have also been put out for discussion these past two years in preparation for the new decade (CBD 2019).
The benefits of urban biodiversity are immeasurable. Preserving biodiversity in municipalities not only preserves the ecological function of the flora and fauna native to the area but also enhances human well-being (Elmqvist et. al 2015). Carrying out urban biodiversity plans can help ecosystems flourish and provide raw resources for the community along with a multitude of benefits within the city infrastructure itself. Plants provide clean air and water, something that is sometimes negligible in large cities, as well as natural wastewater treatment (Australia State of Environment 2016). Animals and insects can also assist in natural pest control by controlling populations that have flourished in an unbalanced ecosystem that cities often are. To ensure the future of the world, UBHub will carry on with working with municipalities, programs and movements to advance urban biodiversity across the world.
References/Works Cited
Australia State of Environment (2016). Importance of Biodiversity. Australia State of Environment 2016
https://soe.environment.gov.au/theme/biodiversity/topic/2016/importance-biodiversity
CBD, C. B. D. (2012). Cities and biodiversity outlook. Pdf. Retrieved from WorldCat: http://public.eblib.com/choice/publicfullrecord.aspx?p=3291658
CBD, C.B.D. (2019) Biodiversity Year in Review. Convention on biodiversity.
https://www.cbd.int/article/2019-12-20-16-57-49
City Nature Challenge (2020). About: City Nature Challenge City Nature Challenge, 2020, citynaturechallenge.org/about/.
Footprint Network (2020). Ecological Footprint. Global Footprint Network, www.footprintnetwork.org/our-work/ecological-footprint/.
Elmqvist, T., Setälä, H., Handel, S.N., van der Ploeg, S., Aronson, J., Blignaut, J.N., Gomez-Baggethun, E., Nowak, D.J., Kronenberg, J., and de Groot, R. (2015). Benefits of restoring ecosystem services in urban areas. Current Opinion in Environmental Sustainability, 14, 101-108.
Laurans, Y., Kinniburgh, F., and Rankovic, A. (2018) 2018-2020: an outburst for biodiversity? IDDRI, https://www.iddri.org/en/publications-and-events/blog-post/2018-2020-outburst-biodiversity
McDonald Robert et al. (2018) Nature in the urban century. The Nature Conservancy, Arlington. https://www.nature.org/en-us/what-we-do/our-insights/perspectives/nature-in-the-urban-century/
Pierce, J. R. (2014). Planning for Urban Biodiversity in a Divided World. Master’s thesis, Cornell University, Ithaca, NY.
Weisbrot, Mark (2014). Why Has Europe's Economy Done Worse than the US? | Mark Weisbrot. The Guardian, Guardian News and Media. www.theguardian.com/commentisfree/2014/jan/16/why-the-european-economy-is-worse.
[1] Palmer Station, a US research station based in Antartica, took part in the City Nature Challenge in 2018. (https://citynaturechallenge.org/about/)


No comments:
Post a Comment